Stupid Eclipse trick — Dynamic Tracing with Conditional Breakpoints
So I’m debugging a chain of Sakai helpers and I ask myself…
“Self, is there an easy way to use the Eclipse debugger to fake some runtime/dynamic tracing?”
And the answer is a resounding “yes!”
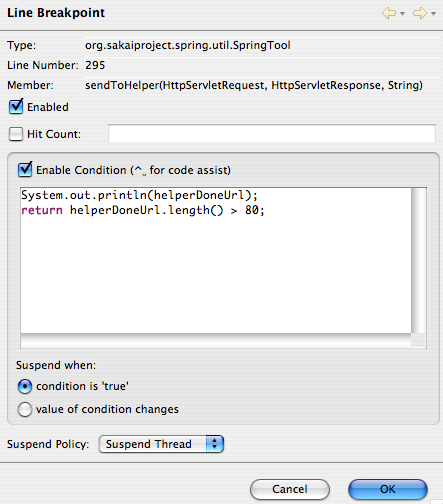
If you set up conditional breakpoints at the places where you want those debug statements and inject some great println justice, magic is made. Eclipse is also nice enough to allow blocks of code or expressions. This means you can use just the println like an expression if you don’t care about the breaks, or make a println and a return if you do. See the screenshot for a somewhat nonsensical example.
All of this can be yours with a single startup of Tomcat and a tail -f. If you’re lucky enough to be hacking something in *-tool, life is even better. Save, mvn install sakai:deploy, relaunch your debug scenario, and keep an eye on that terminal. Somebody who knows what they’re doing with Eclipse could probably tell you how to even target an IDE view – catalina.out is fine for me, though.
…And for quick reference, you can right click on a breakpoint in the left-hand trough and select Breakpoint properties or use the Breakpoints view. On a Mac, Cmd-Shift-B toggles a breakpoint on a line, but getting to the properties with the keyboard is a pain (Opt-Shift-Q, B). In there, a natural-feeling sequence of arrows and Opt-Enter or a right click opens the dialog. Getting back to the editor is easier: F12.
Happy hacking! -NB
blog comments powered by Disqus